Identifying Similarities and Differences
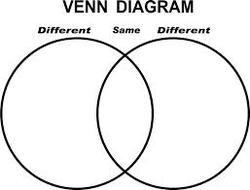
Venn Diagram
Time Needed:
At least 15 minutes should be allotted for the use of a Venn Diagram in order to allow for brainstorming, categorization, and discussion of diagrams.
Room Arrangement:
Since discussion will help generate deeper comparisons, this strategy will be used in group form. Hence, desks should be arranged in pairs or in clusters of 4 that face each other.
Materials:
Large paper posted on board for whole class Venn Diagram, worksheets depicting intersecting circles, extra paper for brainstorming.
Process Directions:
See attached diagram of the flow of events for using a Venn Diagram.
When:
See “Lessons Section” for an example of use in a math classroom. In a Spanish classroom, the Venn Diagram could be utilized to compare cultural differences between the USA and a Spanish-speaking country. For example, the class could discuss the similarities and differences between homes in the USA and Guatemala.
Source:
Encyclopedia Britannica (2014). John venn. Retrieved from http://www.britannica.com/EBchecked/topic/625445/John- Venn
(Instructional Resource Center, n.d.)
Concept Formation
Time Needed:
15-20 minutes
Room Arrangement:
Table groups
Materials:
Sticky notes and writing materials
Process Directions:
When:
In ESL and Spanish classes, this strategy could be used to help students think deeply and compare cultural practices in various countries and the US. In math classes, the strategy could be used during a unit on number sets. Students could all generate random numbers (being encouraged to not just used integers but to also consider square roots, imaginary numbers, etc.). Then, in groups, the students could group all of the numbers into set and define their common characteristics through labeling them using mathematical terminology (For example: one set might be the union between the positive numbers and the even numbers). Limiting the number of categories possible would be beneficial in this case.
Source:
Gregory, G. H., & Kuzmich, L. (2007). Teacher teams that get results: 61 strategies for sustaining and renewing professional learning communities. Thousand Oaks, CA: Corwin Press.
Time Needed:
15-20 minutes
Room Arrangement:
Table groups
Materials:
Sticky notes and writing materials
Process Directions:
- The teacher will introduce the topic being discussed. This gives a focus for brainstorming
- Give students each 5-6 sticky notes and have each of them individually brainstorm characteristics pertaining to the given topic.
- After brainstorming has been completed, students will share each of their ideas with the other members of their table group.
- Next, students will work in their groups to organize each of the characteristics on the sticky notes into categories.
- After all members of the group are satisfied with the groupings, the students must then collectively choose a label by which they will identify each grouping.
- After groups have come to consensus, all groups will share out with one another, describing the groupings they came up with, the items in each group, and the process that they took to get there. Other groups should be encouraged to pose questions to one another about why they made certain decisions.
When:
In ESL and Spanish classes, this strategy could be used to help students think deeply and compare cultural practices in various countries and the US. In math classes, the strategy could be used during a unit on number sets. Students could all generate random numbers (being encouraged to not just used integers but to also consider square roots, imaginary numbers, etc.). Then, in groups, the students could group all of the numbers into set and define their common characteristics through labeling them using mathematical terminology (For example: one set might be the union between the positive numbers and the even numbers). Limiting the number of categories possible would be beneficial in this case.
Source:
Gregory, G. H., & Kuzmich, L. (2007). Teacher teams that get results: 61 strategies for sustaining and renewing professional learning communities. Thousand Oaks, CA: Corwin Press.
T-Charts and Y-Charts
Time Needed:
10-15 minutes
Room Arrangement:
Table groups
Materials:
Chart paper and markers
Process Directions:
When:
In math this strategy could be used to compare methods by which two anonymous students went about solving a problem so as to analyze effective means for problem solving. In language classes this method could be used to compare different grammar tenses such as the future and the conditional tenses or the past perfect and past progressive tenses.
Source:
Gregory, G. H., & Kuzmich, L. (2007). Teacher teams that get results: 61 strategies for sustaining and renewing professional learning communities. Thousand Oaks, CA: Corwin Press.
Time Needed:
10-15 minutes
Room Arrangement:
Table groups
Materials:
Chart paper and markers
Process Directions:
- At each table grouping place a large piece of paper.
- Each group should draw a giant T on this chart, and title the page according to the focus of the comparison. For example, the chart might be labeled, “Problem Solving Techniques.”
- Label each side of the chart. For example, the left side of the chart might be labeled, “Student A” and the right side, “Student B”
- Within small groups, students should then discuss and fill in the chart with the items that are pertinent to each side of the chart.
- Each t-chart will then be hung and/or presented so that all groups will have the opportunity to see how the thinking of other groups differed from or matched their own thinking.
- To add additional categories of comparison, a Y-chart, which breaks a circle into three even sections, can instead be used.
When:
In math this strategy could be used to compare methods by which two anonymous students went about solving a problem so as to analyze effective means for problem solving. In language classes this method could be used to compare different grammar tenses such as the future and the conditional tenses or the past perfect and past progressive tenses.
Source:
Gregory, G. H., & Kuzmich, L. (2007). Teacher teams that get results: 61 strategies for sustaining and renewing professional learning communities. Thousand Oaks, CA: Corwin Press.
Metaphors
Time Needed:
5-20 minutes (Time will vary greatly based on the metaphor).
Room Arrangement:
Traditional forward facing set up. Desks grouped by twos for partner work.
Materials:
Document Camera and projector, writing paper, writing utensils of multiple colors, highlighters, various visuals to aid in metaphor.
Process Directions:
When:
Metaphors can be used LIKE CRAZY in math teaching, especially when explaining new or abstract concepts. For example, the “sandwich” analogy (Rapport, 2008) could be used to help the students learn how to more quickly divide by fractions. In order to teach simplifying square roots, the metaphor of only those with a date get to go to the dance can be used to illustrate the idea of factoring the expression underneath the square root and pulling all “pairs” to the outside of the square root. The metaphor of baseball seats can be used to help explain the idea of place value and a thermometer helps explain the concept of negative numbers. Complex grammar points and conjugation algorithms can also be more easily remembered in language learning classrooms through the use of metaphors. Click here to check out more math metaphor ideas.
Source:
Levin, T., & Wagner, T. (2006). In their own words: Understanding student conceptions of writing through their spontaneous metaphors in the science classroom. Instructional Science, 34(3), 227-278. Retrieved from http://search.proquest.com/docview/740288457/abstract/652EBED24D1A4A2DPQ/1?accountid=13998
Time Needed:
5-20 minutes (Time will vary greatly based on the metaphor).
Room Arrangement:
Traditional forward facing set up. Desks grouped by twos for partner work.
Materials:
Document Camera and projector, writing paper, writing utensils of multiple colors, highlighters, various visuals to aid in metaphor.
Process Directions:
- Begin by clearly describing all relevant objects used in a metaphor and their pertinent relationships to one another.
- Next, introduce the mathematical (or language/cultural) aspect to be compared to the metaphor.
- Use pictures and colors to make connections between the academic and metaphorical subjects very clear.
- Model several examples of solving problems while thinking aloud to demonstrate use of the metaphor in problem solving and decision making.
- Have students explain the metaphor to their elbow buddy in their own words.
- Have students complete several practice problems with partners and then individually, using the metaphor as they verbally explain to one another how they are solving each problem.
When:
Metaphors can be used LIKE CRAZY in math teaching, especially when explaining new or abstract concepts. For example, the “sandwich” analogy (Rapport, 2008) could be used to help the students learn how to more quickly divide by fractions. In order to teach simplifying square roots, the metaphor of only those with a date get to go to the dance can be used to illustrate the idea of factoring the expression underneath the square root and pulling all “pairs” to the outside of the square root. The metaphor of baseball seats can be used to help explain the idea of place value and a thermometer helps explain the concept of negative numbers. Complex grammar points and conjugation algorithms can also be more easily remembered in language learning classrooms through the use of metaphors. Click here to check out more math metaphor ideas.
Source:
Levin, T., & Wagner, T. (2006). In their own words: Understanding student conceptions of writing through their spontaneous metaphors in the science classroom. Instructional Science, 34(3), 227-278. Retrieved from http://search.proquest.com/docview/740288457/abstract/652EBED24D1A4A2DPQ/1?accountid=13998
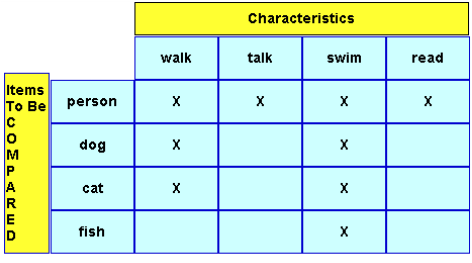
Comparison Matrix
Time Needed:
20-25 minutes.
Room Arrangement:
Desk pods of 2-4
Materials:
One comparison matrix chart per student, writing utensils, writing materials
Process Directions:
When:
In math comparison matrices could be used to compare different types of graphs and their equations in order to show the effects that exponent powers, non-variable expressions, and positive or negative values have on the graph’s shape. In ESL and Spanish classes, comparison matrices could be used to show conjugation patterns and compare meanings of different words.
Source:
Hall, T., & Strangman, N. (2002). Graphic organizers. Wakefield, MA: National Center on Accessing the General Curriculum. Retrieved from http://aim.cast.org/learn/historyarchive/backgroundpapers/graphic_organizers
Time Needed:
20-25 minutes.
Room Arrangement:
Desk pods of 2-4
Materials:
One comparison matrix chart per student, writing utensils, writing materials
Process Directions:
- Identify the topics being compared.
- Provide reference materials (ex: textbooks, internet pages, class notes from previous lessons, etc.) for students to use in researching.
- Allow students time to fill in the comparative matrix with the characteristics of each item using the help of reference materials. Student may work in pairs or individually.
- Display a completed copy of the comparison matrix on the overhead for students to check their work on, or fill it in as a class discussing each point as it is filled in.
- Use comparison matrices for a study tool.
When:
In math comparison matrices could be used to compare different types of graphs and their equations in order to show the effects that exponent powers, non-variable expressions, and positive or negative values have on the graph’s shape. In ESL and Spanish classes, comparison matrices could be used to show conjugation patterns and compare meanings of different words.
Source:
Hall, T., & Strangman, N. (2002). Graphic organizers. Wakefield, MA: National Center on Accessing the General Curriculum. Retrieved from http://aim.cast.org/learn/historyarchive/backgroundpapers/graphic_organizers
(Graphic, n.d.)
